Skip to content
Case study

Work/Rawnest Group

Rawnest Group

Four kitchens were throwing out about a third of what they bought. Nobody could say which third.

SectorHospitality · four brands
EngagementSystems & measurement
PracticeGrow
Client since2021
MeasuredYes · before and after
Live siterawnest.co
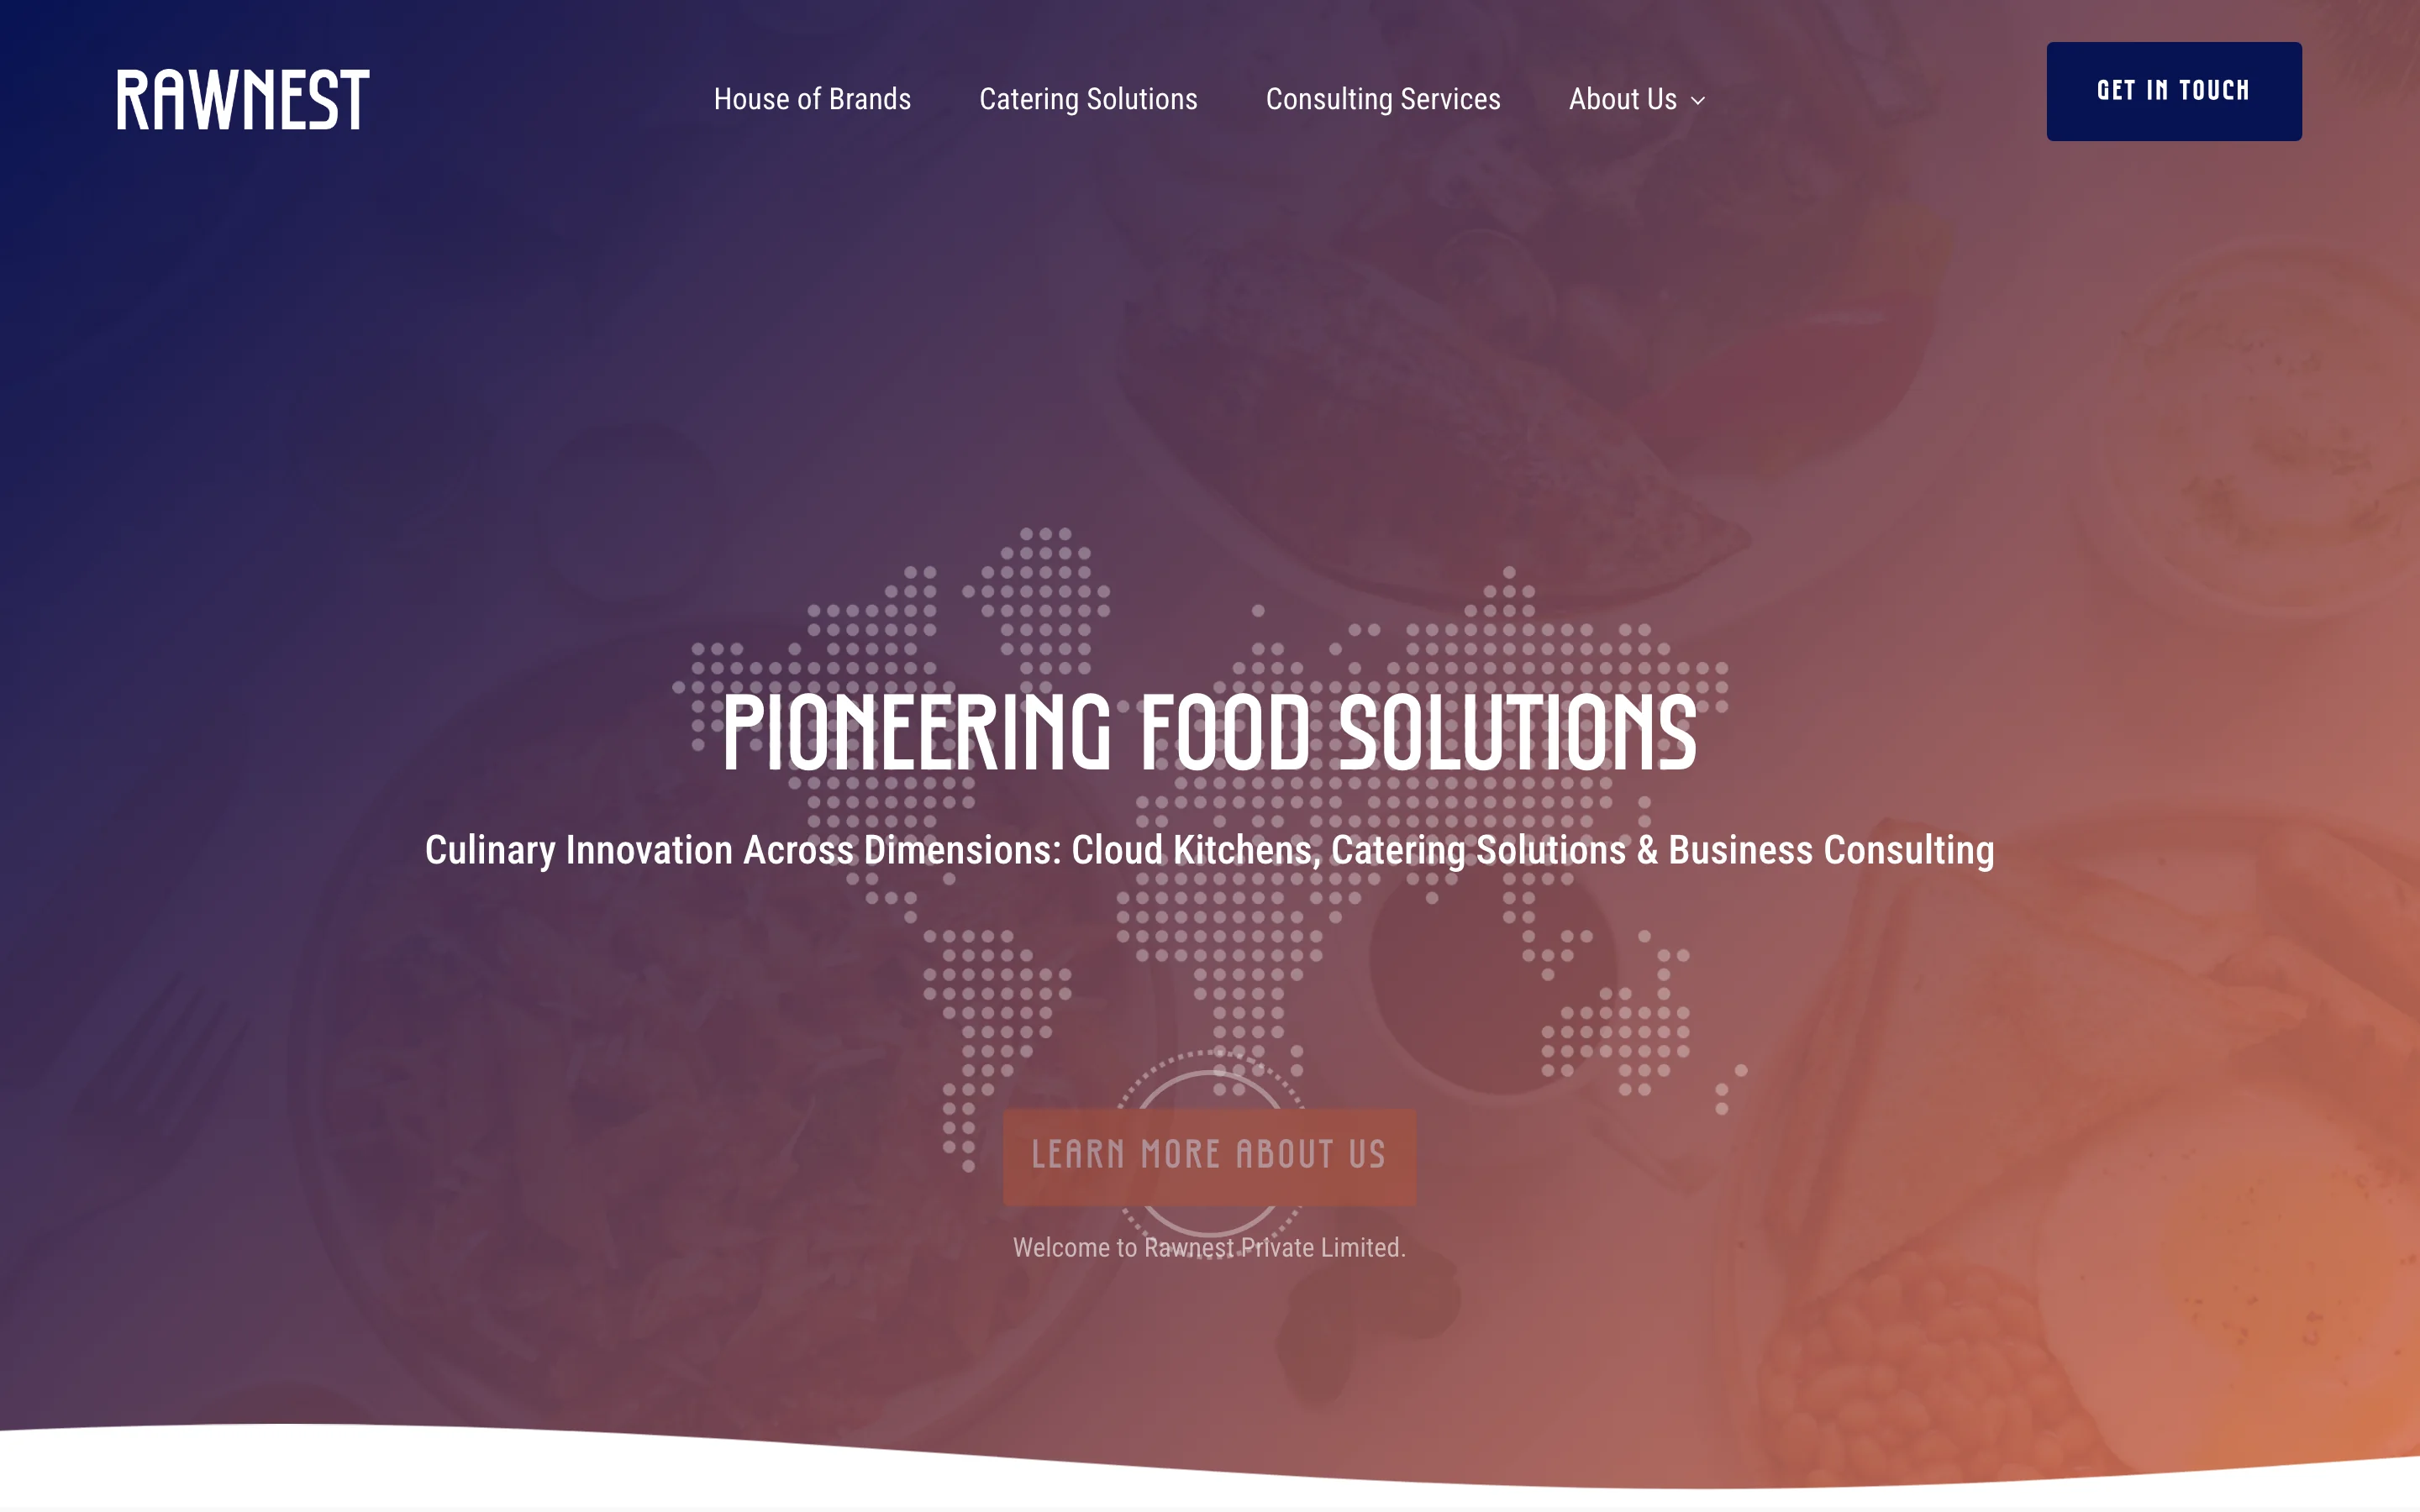
Rawnest Group website
The result
Monthly waste
30%→6%

Before-and-after measurements by Rawnest’s internal team using its own tracking systems. Waste percentage is the value of wasted product divided by the total value of purchased goods, expressed as a percentage.

MetricWasted product value / total purchased goods value, expressed as a percentage
SourceRawnest’s internal team and tracking systems
Brands coveredFour
The work
01 — Context

Four brands out of one kitchen operation.

Rawnest runs four hospitality brands from a shared kitchen. Each has its own menu and its own demand pattern. Most of them buy the same twenty ingredients.

Ordering was done from memory — roughly what last week looked like, adjusted by feel.

02 — The problem

Waste was visible. Its cause wasn’t.

About a third of deliveries went out as waste. That much was known.

What wasn’t known was the cause: over-ordering, poor rotation, menu mix, or one brand’s errors being absorbed by another’s margin. Without attribution the only available fix is to buy less and risk running out.

03 — What we did

Put purchasing and sales in the same place.

Stock counts were connected to daily sales per brand. Both numbers already existed; neither had ever been read against the other.

Over-ordering became a line item instead of a suspicion.

04 — Result

Thirty per cent to six.

Same measure taken the same way at both ends. The conditions are listed above because a waste figure without a period and a source isn’t worth much.

See it for yourselfrawnest.co →
Next
Start here
We’ll reply within two working days

Tell us what you’re planning.

Whether that’s a new build, something that’s stopped working, or ongoing help with a site you already have.